🔒 How to debug HTTPS traffic
Sometimes we deal with well-secured scenarios where there are no many ways to check HTTP traffic. And in these cases, common tracing tools are not enough.
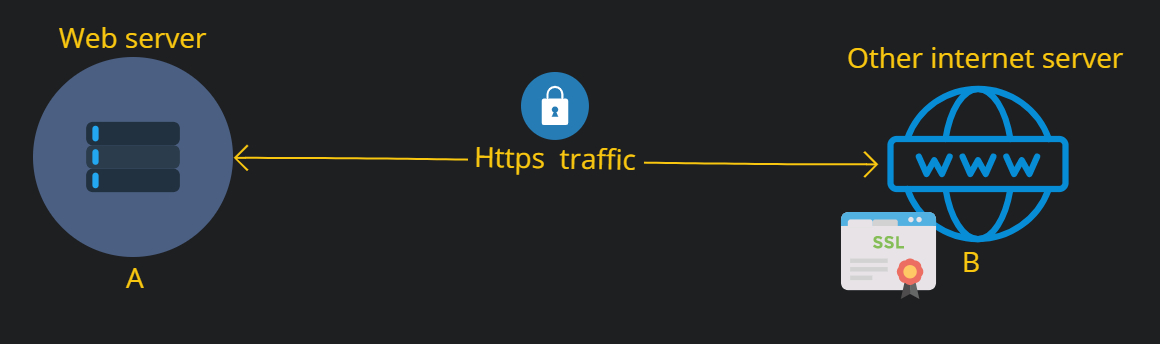
Consider the next communication:
A webserver A, making a request to another internet server B. Traffic is encrypted thanks to HTTPS protocol supported by the SSL certificate of B.
What do we talk about?
We are going to talk about request scoped traces. Notice that HTTP is a request/response protocol, running over TCP packages, commonly we want to debug the information related to headers, query string params, body contents.
In other cases, we need the HTTP request/response dialog sequence, to know if there is a CONNECT method request before or just to know if the response of a request was completed before another request. All this application layer content is encrypted and protected with HTTPS.
Basically, there are two ways to see HTTPS data under the hood:
Intercepting traffic from inside the BOX:
That’s, you can easily intercept traffic using HTTP interceptors inside HTTP clients, in A. This feature enables you to access to HTTP client request/response message pipeline.
Example using NET Core:
var httpClient = new HttpClient(new InterceptorDelegatingHandler(logger));public class InterceptorDelegatingHandler : DelegatingHandler {
private readonly ILogger logger;
public InterceptorDelegatingHandler(ILogger logger) {
this.logger = logger;
InnerHandler = new HttpClientHandler();
}
protected override async Task<HttpResponseMessage> SendAsync(HttpRequestMessage request, CancellationToken cancellationToken) {
logger.Log(LogLevel.Debug, request.ToString());
var response = await base.SendAsync(request, cancellationToken);
logger.Log(LogLevel.Debug, response.ToString());
return response;
}
}Now, you just added one more layer to the request/response pipeline, where you have access to the HttpRequestMessage, at this point you can modify the message, but in this example, we only log it.
Maybe you are thinking that telemetry tools like Application Insights will automatically log this dependency call, but, for security reasons, Application Insights do not trace this kind of information by default.
You can do exactly the same in Javascript, for example with axios using the same interceptor concept.
Intercepting and decrypting Https traces using a web proxy
Now we will introduce a web server debugging tool as a proxy in the middle, like Fiddler:
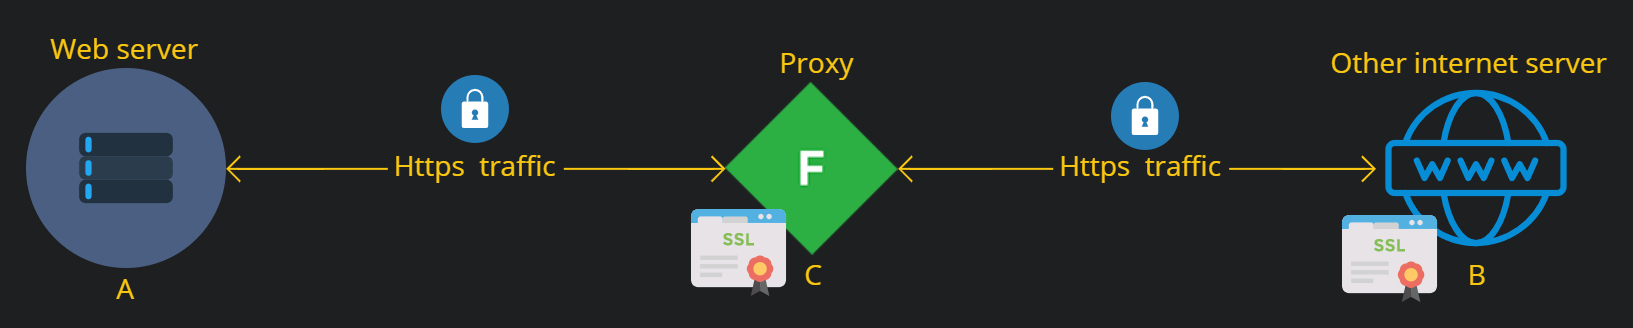
The difference with the first example is that in this case now we have a proxy C, in the middle. This will let us monitor and decrypt the traffic in the network.
To setup the proxy:
- You need to redirect your
Aserver outgoing traffic trought the proxy.
In NET Core:
HttpClient.DefaultProxy = new WebProxy("127.0.0.1:8888");or in NET full framework 4.6:
<system.net>
    <defaultProxy enabled = "true" useDefaultCredentials = "true">
        <proxy autoDetect="false" bypassonlocal="false" proxyaddress="http://127.0.0.1:8888" usesystemdefault="false" />
    </defaultProxy>
</system.net>- You need to trust in the proxy
CSSL certificate, adding it as a trusted root certification authority.
Now you will be able to decrypt the traffic 😛, this method is more tedious to implement but more powerful.
NOTE: Optionally, if outgoing traffic needs specific extra authentications, like SSL client certificates, you need to configure it in the proxy.
Other usages
The same strategy can be applied for example to debug browser traffic, or Android emulators traffic.
This kind of tool can help us with transport layer problems like TLS/SSL handshake problems, but usually more sophisticated tools like protocol analyzers or sniffers like Wireshark can help you more here.